Blog · Contributions & statements
Church giving statistics and trends for 2026
June 27, 2026 · By Benjamin Reinke
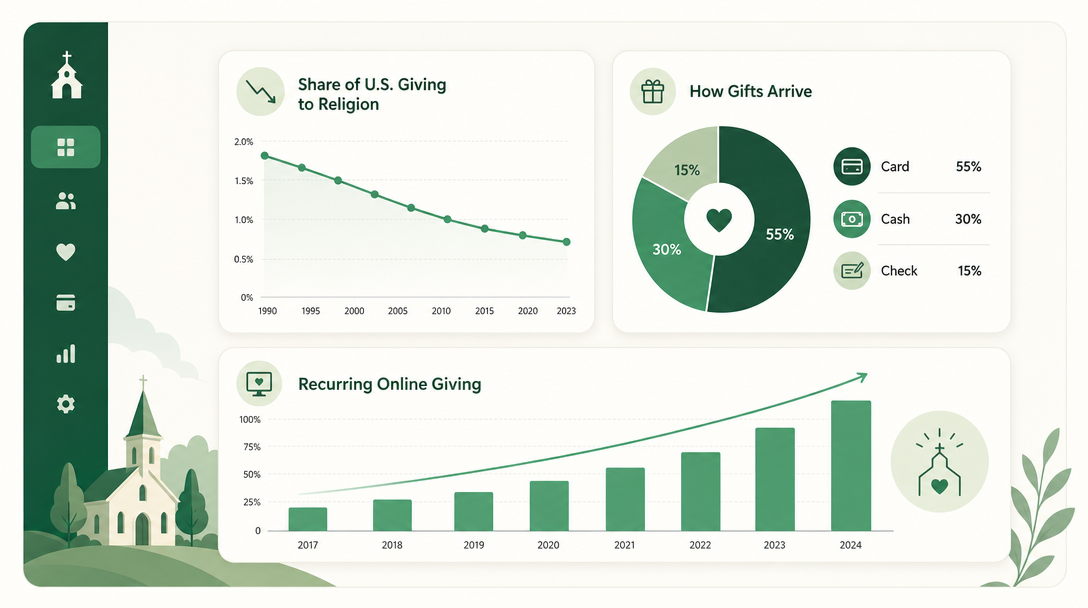
The headline numbers, up front: Americans gave an estimated $592.50 billion to charity in 2024, and giving to religion — about $146.54 billion — was still the single largest category, according to Giving USA 2025. But religion’s share of US giving keeps shrinking: it was roughly 23–24% in 2024, down from 34% in 2011 (Lake Institute on Faith & Giving), and over half of all giving decades ago. Meanwhile, how the money comes in is changing fast — recurring and online gifts are taking over. Below is what the data actually says, with every figure tied to its source.
A note on sources: the macro totals here come from Giving USA (the Indiana University Lilly Family School of Philanthropy), the standard reference for US charitable giving. The behavior figures — average gifts, payment methods, recurring rates — come from named industry and giving-platform reports drawn from their own donor datasets, so they vary by provider, year, and method. Treat them as directional, not gospel, and we’ve attributed each one.
Religious giving is huge — but its share is falling
Religion remains the largest slice of American generosity, and it isn’t close. Yet the long-term trend line points down as a share of total giving, even as the dollar figure holds up.
| Metric | Figure | Source |
|---|---|---|
| Total US charitable giving, 2024 | $592.50 billion | Giving USA 2025 |
| Giving to religion, 2024 | ~$146.54 billion | Giving USA 2025 |
| Religion’s share of all US giving, 2024 | ~23–24% | Giving USA / Lake Institute |
| Religion’s share in 2011 | 34% | Lake Institute |
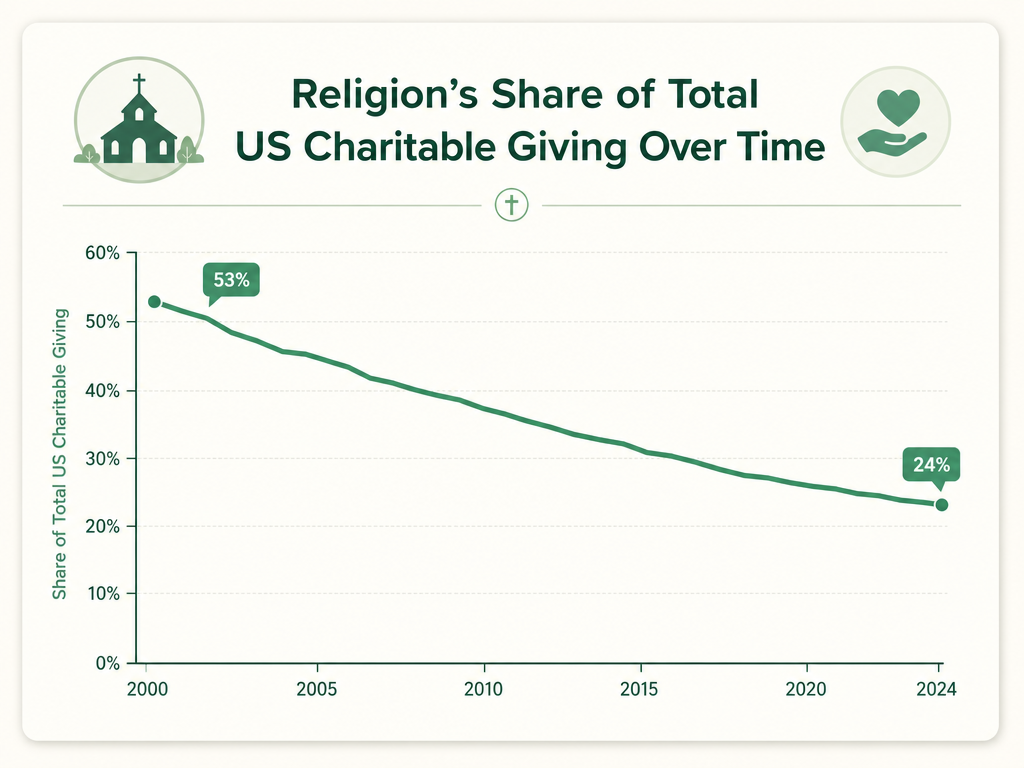
The takeaway for a church isn’t panic — it’s that giving is getting more concentrated and more competitive for attention, which makes clear records and easy giving matter more, not less.
How much people actually give
Average giving per member is where the data gets noisier, because “how much does the average member give” depends entirely on whose dataset you use and how you define a giver. A few figures that come up repeatedly:
- The average single gift to a church is around $215, by industry reporting (Vanco).
- Average weekly giving per attendee lands near $30 in several provider datasets — a useful rule of thumb, not a law.
- By one analysis, the average churchgoer household gives a few percent of income to their church — one figure put it around 4.35% of household income — well under the traditional tithe.
On the tithe itself (a full 10% of income), estimates genuinely conflict. Depending on the study and how “tithing” is defined, the share of churchgoers who give a full 10% has been reported anywhere from the low single digits to around a quarter. The honest summary: a minority of attendees tithe the full 10%, and that share has been roughly flat for years. Don’t quote a single hard number here — the methodologies are too different. (For what the tithe is and how it’s taught, see tithing at church.)
Online giving has gone from optional to expected
Online giving is the fastest-moving part of the data, and the part most relevant to a church deciding how to collect gifts. The pandemic permanently shifted giving online.
- The share of churches offering online giving jumped from roughly two-thirds before the pandemic to a large majority afterward — one report put places of worship offering digital giving at 98% by 2023, while a 2025 figure put churches specifically offering online giving around 74% (Pushpay). Either way, the direction is one-way.
- Giving is now roughly split between digital and traditional methods among churchgoers, where a few years ago cash and check dominated.
- Churches that actively promoted online giving have reported around a 32% increase in donations (Vanco) — promotion, not just availability, is what moves the number.
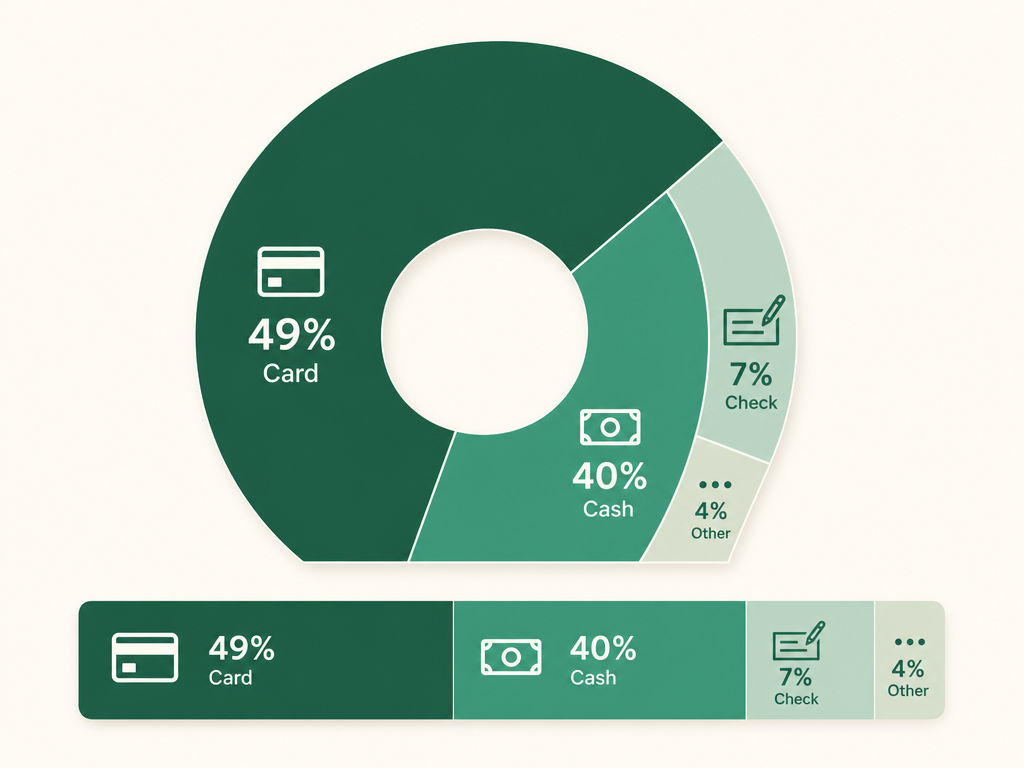
How the gifts arrive, by industry reporting:
| Method | Share of church gifts | Note |
|---|---|---|
| Card (credit/debit) | ~49% | The largest single channel |
| Cash | ~40% | Still significant, and the hardest to track |
| Check | ~7% | Declining |
| Other | ~remainder | ACH, text, app |
One more wrinkle worth knowing: bank (ACH) gifts tend to be larger than card gifts — one dataset put the average ACH gift near $217 versus about $135 for cards — because ACH avoids per-transaction card fees on bigger gifts.
Recurring giving punches far above its weight
If there’s one trend a church treasurer should act on, it’s recurring (automatic) giving. The data is lopsided in its favor across nearly every provider report:
- Recurring givers are a minority of donors but a large share of dollars — commonly reported as roughly 22% of givers driving about 40% of total giving.
- Recurring online givers give materially more than one-time givers — one report put it at around 120% more.
- Automatic, recurring donations now make up a substantial and growing share of all church transactions and dollars across digital-giving platforms.
The reason is simple: recurring gifts don’t depend on attendance. A member who set up a monthly gift keeps giving through the summer slump, the bad-weather Sunday, and the vacation month — which is exactly when budgets get squeezed.
What the numbers mean for a small church
Pulling the data together, four things stand out for a church planning its finances:
- Make online and recurring giving easy. The trend is one-way, and recurring givers carry a disproportionate share of the budget. A church without a simple recurring option is leaving its most stable income on the table.
- Budget income conservatively. Giving is concentrated among a minority of households, so a few families moving can swing the budget — plan for it (see church budget percentages).
- Track every gift to the giver and fund. With nearly half of gifts digital, clean records are easier than ever — and they make the year-end contribution statements donors need build themselves.
- Watch the fees. Card gifts carry processing fees, and some platforms add a cut on top — which is why church online giving with no added platform fee keeps more of each gift in the ministry.
FAQ
How much does the average church member give? It depends heavily on the dataset, but industry reporting commonly puts the average single church gift around $215 and average weekly giving per attendee near $30. By one analysis the average churchgoer household gives a few percent of income — around 4.35% in one 2022 figure — which is well below the traditional 10% tithe. These are directional figures; methodologies vary widely.
What percentage of church members tithe? Estimates conflict. Depending on the study and how “tithe” is defined, the share of churchgoers who give a full 10% of income has been reported anywhere from the low single digits to around a quarter. The consistent finding is that a minority of attendees tithe the full 10%, and that share has been roughly flat for years.
How much do Americans give to religion each year? About $146.54 billion in 2024, making religion the largest single category of US charitable giving, according to Giving USA 2025. That was roughly 23–24% of all US giving — down from 34% in 2011 and over half several decades ago.
Is online giving better than cash for churches? The data favors it for stability: online giving is now roughly half of all church gifts, recurring online givers give materially more than one-time givers, and churches that promote online giving have reported around a 32% lift in donations. Online gifts also track themselves, where cash is the hardest method to record accurately.
Vestrybooks records every gift — online or in person — to the giver and the fund automatically, so the statistics that matter for your church are a report away, and year-end statements build themselves. See how it works.
Figures are drawn from Giving USA 2025 (macro) and named industry/giving-platform reports (behavior); industry datasets reflect each provider’s own donors and vary by source and year.
This article is general information for church treasurers, not professional tax or legal advice. For your church's situation, consult a qualified accountant or attorney.
Track every gift, print statements in one click.
Vestrybooks records each gift by donor and fund, builds IRS-ready year-end statements, and takes $0 of every online gift.
A real free plan · no credit card · your data stays yours